Some days ago, a friend of mine, Ram, put me on the track of Splunk, I’ve never noticed it, so I downloaded it and at the first glance I knew it was perfect for the Logger component of the Dashboard’s architecture, let’s remember it (if you are new to this blog see the previous posts):

So, I put to test a little with it. Let see all after the jump.
First of all, a little introduction of Splunk, as his website says, Splunk is a platform that collects and indexes any machine data from virtually any source in real time. Search, monitor, analyze and visualize your data to gain new visibility, insight and intelligence.
Ok a lot of buzzwords there, lets summarize this. I can connect to any source of data (logs, database, JMS topic/queue, files..), compound any search, in natural language with useful commands and logic operators, wildcards, pipes (yes, UNIX like), index the data, correlate the results (Do I hear CEP buzzword?) and present the results in a beautiful dashboard. All this in a very near “real-time” on a browser.
So lets put this in practice:
The Logger has two main objectives:
- Record any event, expected or not, in the platform. Application exceptions, log events, some app milestones, etc.
- Use it for analyzing the nature of the events recorded, its frequency, its types, in time dimension, but… why not to register business events? As delayed flights, or better, number of messages produced with delayed flights, or haw many data/messages produces an airport process managed by the Aeriaa Dashboard…etc, etc.
The last objective comes to my mind using a bit Splunk.
I have to say that I’m developing the Business Model Logic component (see the architecture diagram above) in Java/Spring and the Data Distribution Bus with ActiveMQ (by the moment). So put the pieces together.
At this time I have an “horrible designed” airport’s scenarios simulator (I call it “The Awful Simulator”, TAS) that sends events to the platform (Business Model Logic -> Data Distribution BUS), I’m using this tool in order to incrementally test all the architecture components.

The Awful Simulator
The TAS publishes Flight Events messages through the Data Distribution Bus (DDS), deployed with ActiveMQ, by the topic AERIAA.EVENTS.FLIGHTS (you can learn more about JMS and topics in this website, and soon in my book “State of art of new technologies applied to airports Processes, integration services, complex events processing and dashboards”, sorry the first edition is in spanish and it will be free, please let me know if you want an electronic copy by LinkedIn or Facebook).
The DDS carries the message, and Splunk has configured a Data Input that it is connected to the DDS and to this topic from where the messages will arrive (AERIAA.EVENTS.FLIGHTS). See the Data Input configuration in the next picture:
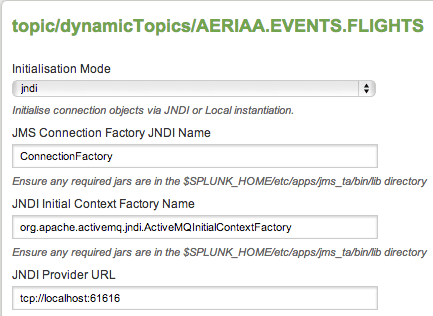
Splunk JMS Configuration
At Splunk I configured a real basic search pattern for listening and searching the events that comes by this JMS topic looking for the Java object that generates the event that comes as a payload in the message, in this case, the Java object that represents the flight event is com.aeriaa.events.types.FlightEvent
The next picture shows schematically this logger’s use case.

Logger’s Use Case
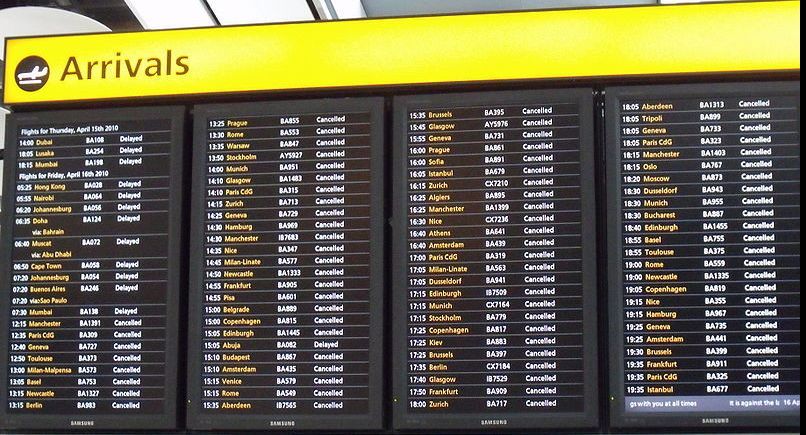
So I started to generate, on the TAS, Flights events (delayed flights, new gates assignments, status changes, etc.) and the events are starting to consume by Splunk. The next screen capture shows the events capturing by Splunk and how are they shown in the default dashboard view. (Please, click on it to enlarge the image).

Capturing Flight Events with Splunk (Click to enlarge the image)
Voilá, 139 event’s messages published by the TAS shown at Splunk. If you clicked on the image you have noticed several details:
- The time’s bar series, that represents and summarizes the number of messages captured.
- The search pattern recognition on every message, marked in yellow.
- On the left side, the other fields that we can drill down or use for the search pattern to get more information.
This is only the default view with no customization. I’ll be customize the view panels, the charts, the search patters, etc. as the demo get developed.
I would like to thank Damien Dallimore, Splunk Evangelist, that helped me, as a Splunk newbie, to configure correctly the JMS add-on.
See you in next posts.
For more info:
Aeriaa Dashboards Series: Aeriaa Dashboard
Splunk platform: Splunk

This work by Pedro Garcia is licensed under a Creative Commons Attribution-NonCommercial-ShareAlike 3.0 Unported License